Research · 2020
A web interface for process analytics
A full-stack web interface for configuring process-analytics models and visualizing their training logs and results.
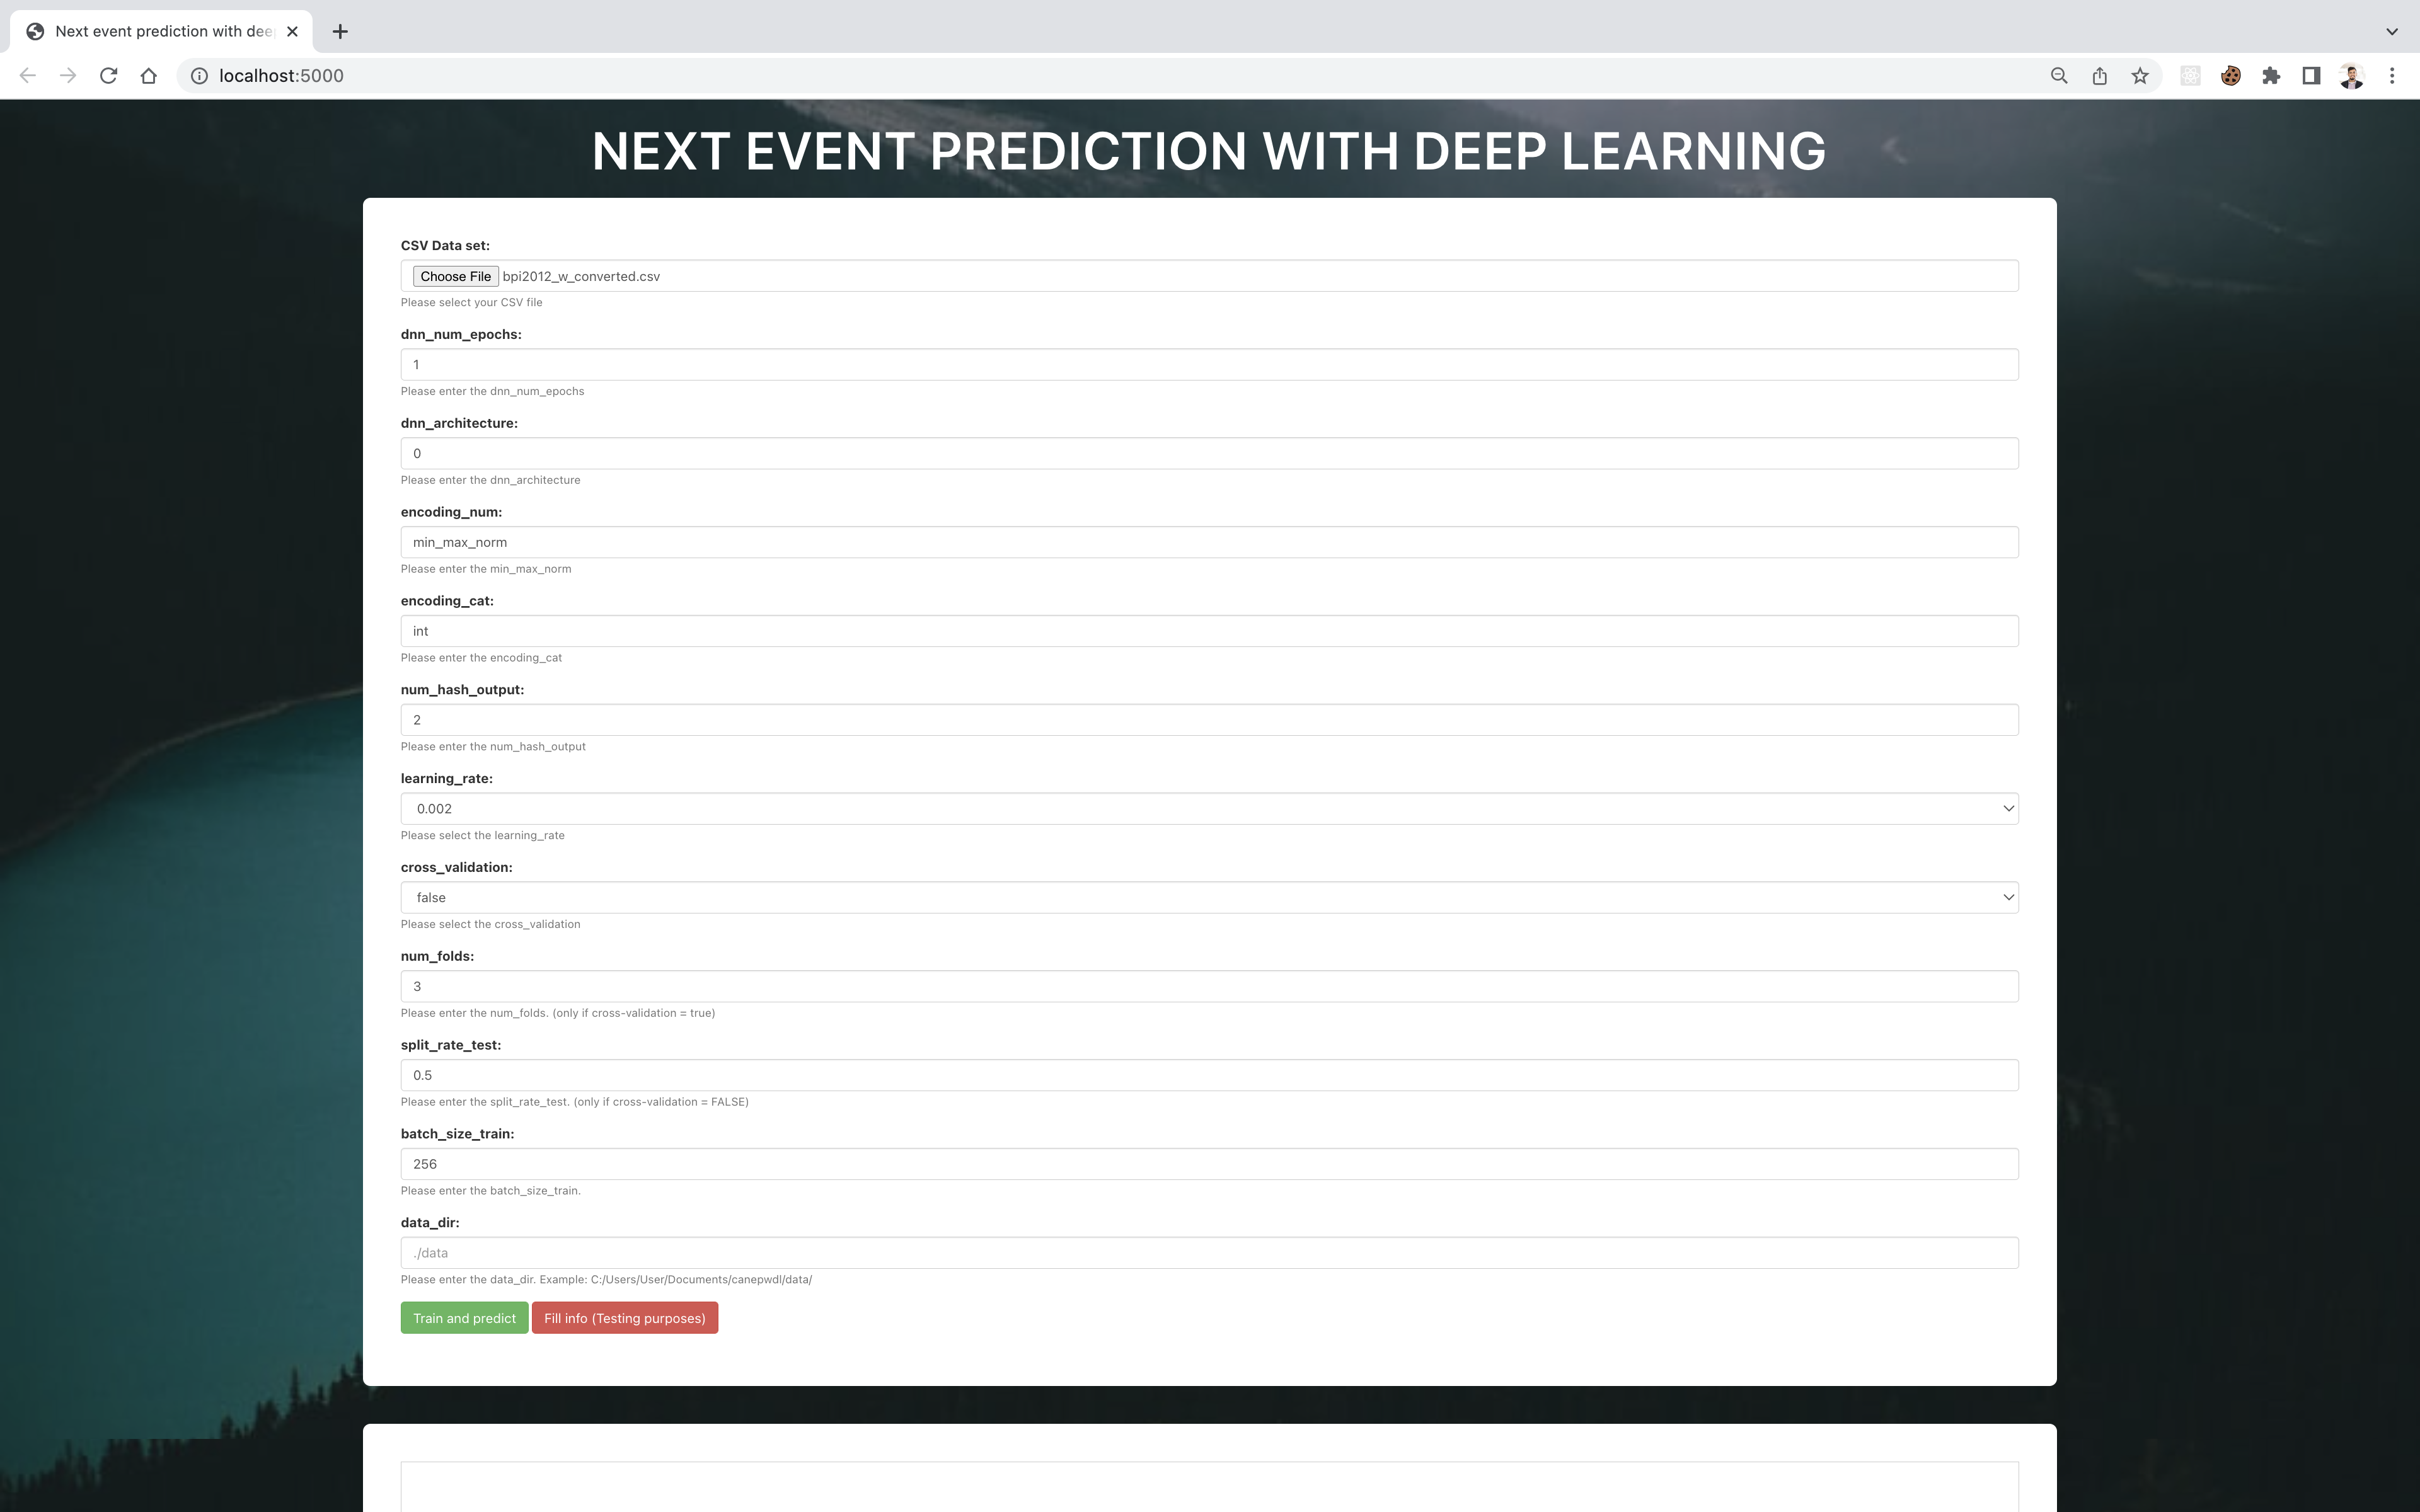
I worked for one year at the university as a research assistant. At the chair of digital industrial service systems.
The guys on my team were researching ML/DL approaches to process analytics. One project dealt with different deep learning architectures to predict upcoming events.
The interaction with the engine was done using the terminal, and all the parameters to run experiments were hardcoded in configuration files.
My task was to create a full-stack system to interact with the engine and showcase the results in a friendly, interactive way.
With the web UI, the user could easily select the parameters to run the engine and tests.
Using REST, the CSV with data was uploaded to the backend and using WebSockets, the engine sent back the logs and results to the UI.
The results of the training were plotted into charts using Chart.JS